.png)
Cash Flow Report | Power BI Cash Flow Dashboard PBIX
- Apr 12
- 1 min read


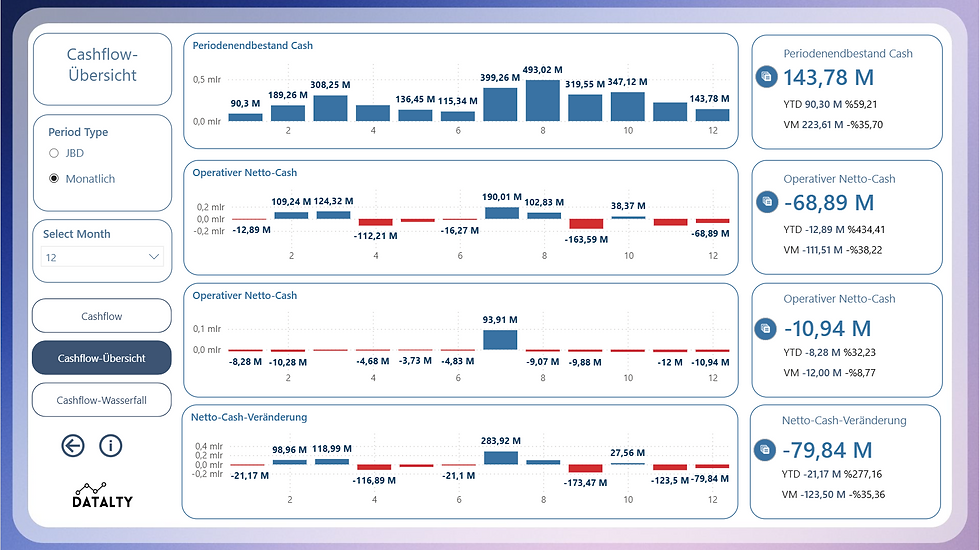
The cash flow report allows companies to track changes in beginning cash, net operating cash, non-operating cash, and ending cash on a single screen. This Power BI dashboard PBIX instance is designed to analyze cash inflows and outflows in detail, with monthly and cumulative view options.
The report presents operational cash inflows, operational cash outflows, investment activities, financial debt and interest transactions, capital movements, tax payments, and exchange rate effects under separate headings. The cash flow summary screen allows for easy monitoring of monthly trends, net cash change, and end-of-period cash performance.
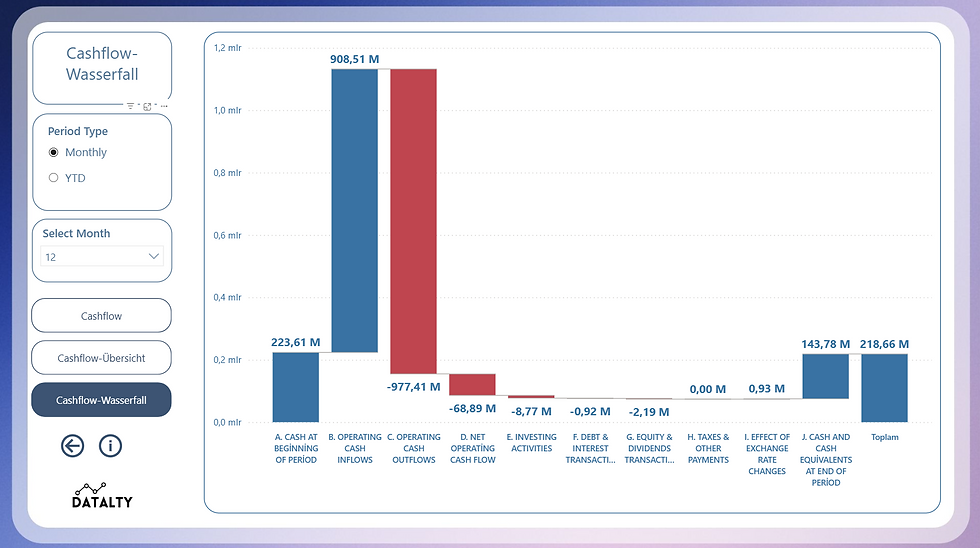
The Waterfall dashboard view visually analyzes all items affecting cash flow. This structure provides a powerful Power BI cash flow dashboard solution for CFOs, finance teams, and management reporting processes. It can be customized to each company's financial structure and developed in PBIX report format.


Comments