.png)

.png)
.png)
.png)
.png)
.png)
.png)
Flexible and sustainable analysis structures
.png)
Data Integration and Architectural Design
We centralize your data from various sources and create well-designed, high-performance data architectures. Integration with ERP, CRM, accounting, and production systems Data warehouse and data mart design Seamless connection with cloud and local data sources Performance optimization and query optimization

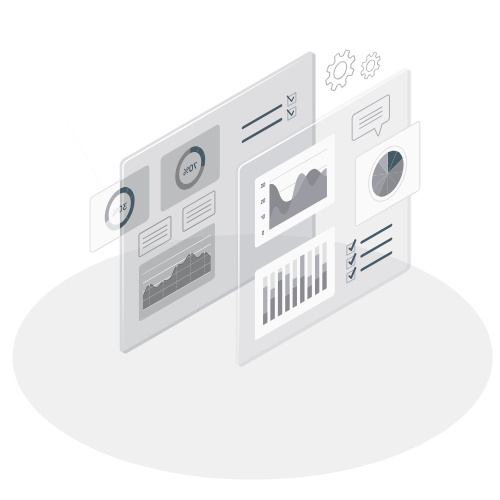
Power BI Reporting and Visualization
We transform your raw data into understandable, interactive, and user-friendly dashboards. Customized KPI dashboards Multilingual reporting (TR/EN/DE) Mobile and web-friendly designs Visual storytelling and dynamic filters
.png)
Financial and Operational Analysis
We strengthen your financial statements, budget comparisons, and operational processes with management-focused reports. Income statement, balance sheet, and cash flow reports Profitability, cost, and performance analyses Budget-actual comparisons Operational process automation and efficiency solutions
Training, Consulting and Special Solutions
We provide training to your team and implement analytics solutions tailored to your needs. Power BI user and developer training KPI and performance management workshops Project-based consulting Industry-specific reporting and advanced analytics projects


Live Report Preview
Explore live report examples Explore the interactive nature of Power BI


Smart Solutions Powered by Data
15+
Annual Reporting Experience
Experience in enterprise-scale data infrastructure, reporting and process design.
70%
Increased Productivity
Reduction in workload through automation and standard reporting processes.
100%
Project Success Rate
Measurable and permanent solutions that fully comply with the goals.
10+
Completed Project
Data and reporting projects successfully implemented in different sectors.

Faster and More Accurate Decisions with the Power of Data
Time Saving
Thanks to automatic data flow and updated reports, your manual workload is reduced and you can focus on analysis and decision-making.
Single and Reliable Data Source
All your data is collected in a single center, eliminating inconsistencies across different sources.
Clear and Effective Visualization
You can easily interpret your data with clear, visually powerful and consistent reports.
