.png)

Sample Report Preview
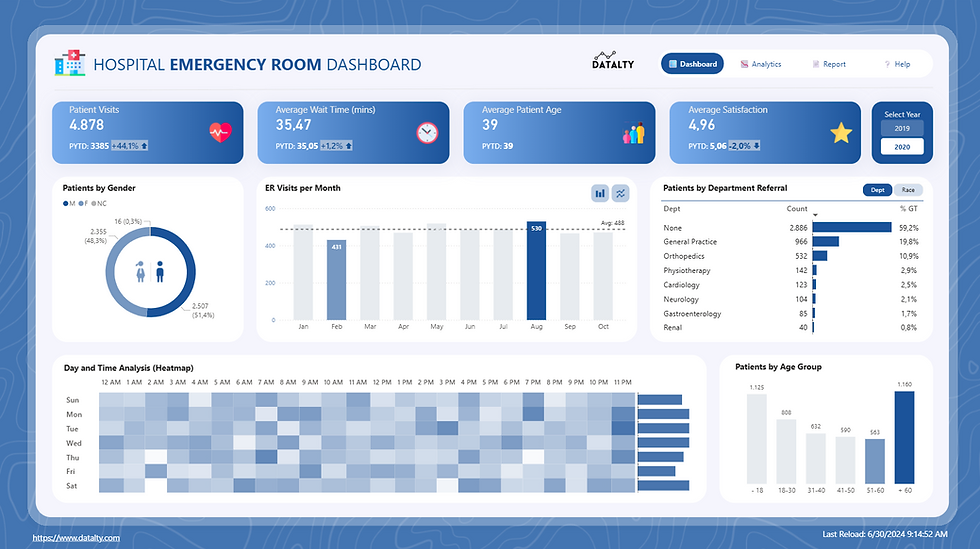
This dashboard was created to analyze hospital emergency department processes in detail and increase operational efficiency. Key performance indicators such as patient visit count, average waiting time, average patient age, and satisfaction rate can be monitored in real-time on the report.
Monthly emergency department visits are analyzed to observe seasonal changes in workload. Thanks to the day and hour-based heatmap visualization, peak patient periods can be easily identified, and resource planning can be optimized accordingly.
Patient distribution is detailed by gender, age group, and referred department, clearly revealing where healthcare services are concentrated. This allows hospital management to more effectively manage patient flow and make data-driven decisions to improve service quality.
This structure is designed to improve operational processes, optimize resource utilization, and increase patient satisfaction in healthcare institutions.


