.png)

Corporate Reporting & Data Management Services
We bring together scattered ERP, Excel, and financial data into a single, reliable reporting structure. Power BI makes it easy for management to access the financial, sales, budget, profitability, cash, and operations visibility they need.

Veri Entegrasyonu

Veri Modeli ve Kontrol

Power BI ve Otomasyon

Yapay Zekâ Asistanı
.png)
.png)
Power BI
Yönetim raporlama
.png)
Copilot
Yapay zekâ desteği

Microsoft Fabric
Birleşik veri altyapısı
.png)
Excel
Veri hazırlama
.png)
Power Automate
Workflow automation
Microsoft Fabric
Birleşik veri altyapısı
.png)
SSMS
Data management
Microsoft Fabric
Birleşik veri altyapısı
.png)
.png)
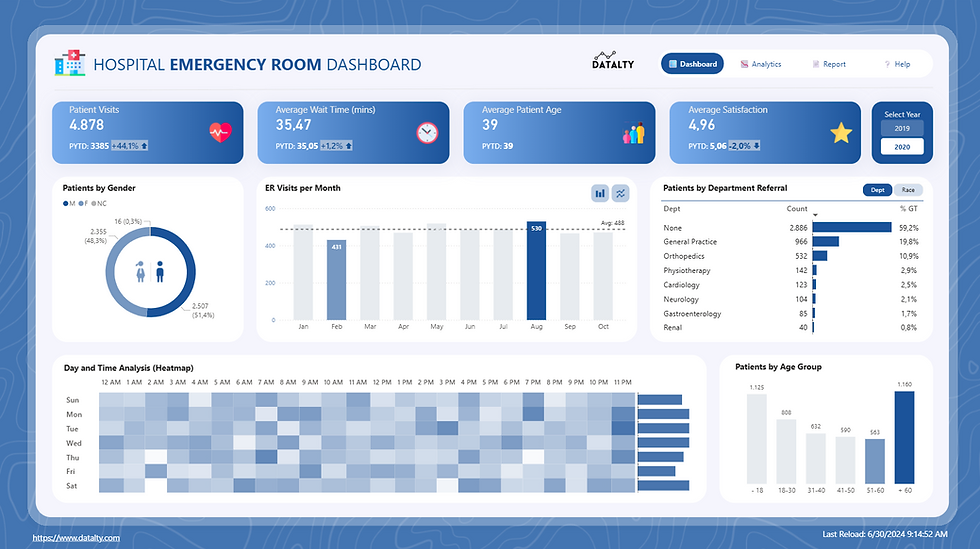
Sample Live Report Preview
Examine report samples live and explore Power BI's interactive nature.
Sample Live Report Preview
.png)
Sample Live Report Preview
.png)
Sample Live Report Preview

Veri Toplama
Farklı sistem ve dosyalardaki veriler alınır ve ortak yapıda birleştirilir.

Veri Düzenleme
Veriler standart yapıya dönüştürülür ve tutarlılık kontrolleri uygulanır.

Veri Modelleme
Finansal ve operasyonel veriler ihtiyaçlara göre modellenir.

Raporlama ve İzleme
Yönetim raporları oluşturulur ve veri yenileme süreçleri otomatikleştirilir.

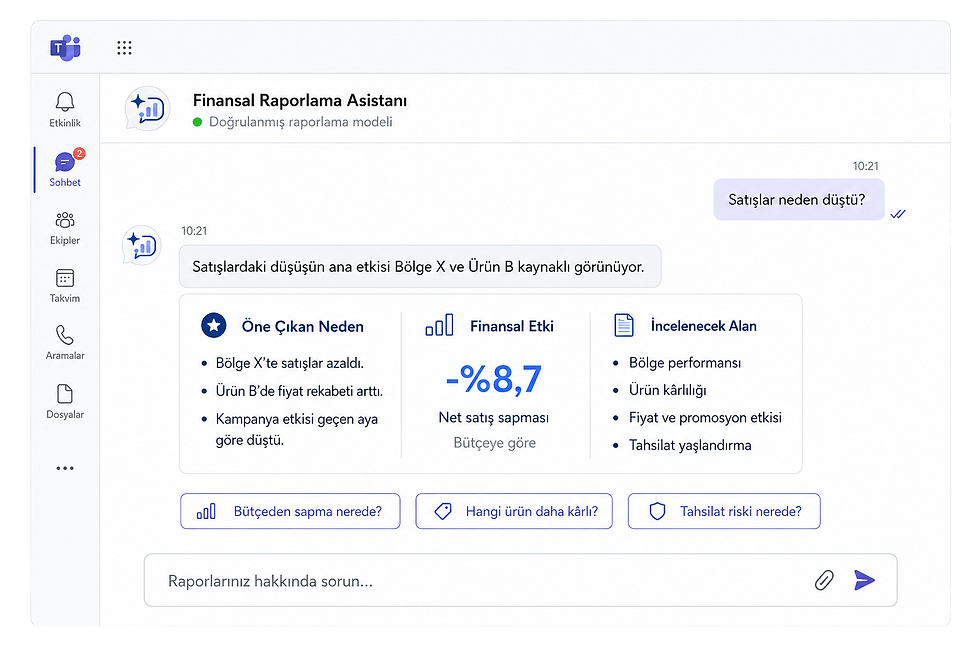
Yapay Zekâ Asistanı
Doğrulanmış raporlar doğal dille sorgulanır, analiz ve özetler oluşturulur.
Sample Live Report Preview

ERP ve Muhasebe
CRM ve Satış
Excel ve Dosyalar
Online Veriler
Diğer Kaynaklar
Report Examples
Sample Live Report Preview
Examine report samples live and explore Power BI's interactive nature.

Report Examples
Sample Live Report Preview
Examine report samples live and explore Power BI's interactive nature.


Report Examples
Sample Live Report Preview
Examine report samples live and explore Power BI's interactive nature.
Sample Live Report Preview
Examine report samples live and explore Power BI's interactive nature.
Raporlarınıza sorun
Yönetim raporlarınızı doğal dille sorgulayın.

Değişimleri anlayın
Sapmaları ve öne çıkan nedenleri hızla görün.

Analiz ve özet alın
Veriye dayalı yönetici özetleri oluşturun.


Sample Live Report Preview
Examine report samples live and explore Power BI's interactive nature.


Finansal Raporlama ve Yönetim Dashboardları
Combine income statement, budget, actual and cash flow data into a single structure; confidently track variations, profitability, and period performance.
01
.png)
Our Services
Reporting, Data Analytics and Automation
Raporlamayı daha görünür, daha anlaşılır ve karar alma süreçleri için daha değerli hale getiriyoruz.
Sales, Profitability, and Business Performance Analytics
Bütçe, hedef, güncel tahmin ve gerçekleşen sonuçları aynı planlama yapısında yönetin. Sapmaları ve yıl sonu beklentisini güncel verilerle değerlendirin.
02
Satış, Kârlılık ve Maliyet Analitiği
Satış hacmini kârlılık, fiyat, iskonto ve maliyet etkileriyle birlikte analiz edin. Ürün, müşteri ve kanal kararlarını aynı veriye dayandırın.
03
Data Integration and Reporting Infrastructure
Nakit, tahsilat, ödeme, stok ve operasyon hareketlerini ortak görünümde izleyin. İşletme sermayesi risklerini dönem sonundan önce fark edin.
04
Veri Entegrasyonu, Raporlama Otomasyonu ve Yapay Zekâ Asistanı
Get regular support for new needs, data checks, and report enhancements; keep your reporting infrastructure up-to-date and usable with your business.
05
Neden Datalty
Reliable Reporting Infrastructure
Financial reporting, data analytics, and Power BI are the key strengths supporting our approach.
.png)
15+ Yıl Deneyim
Finansal raporlama, bütçe yönetimi, operasyon süreçleri ve veri analitiği alanlarında kurumsal deneyim.
.png)
Yönetim Odaklı Yaklaşım
Karar süreçlerini destekleyen finansal, operasyonel ve performans odaklı raporlama yapıları.
.png)
Merkezi Veri Altyapısı
Modern data and dashboard infrastructures that combine different data sources into a single structure.
.png)
Continuous Support Model
Keep your reporting system up-to-date and sustainable through maintenance, development, and user support.

Industry Solutions
Reporting Solutions for Different Business Models
Each sector has different data, decision-making rhythms, and performance indicators. Datalty brings together financial, commercial, and operational data in a reporting structure tailored to your business model.
KPIs tailored to your business model, a reliable data model, and management-focused Power BI reports.
.png)
Üretim ve Dağıtım
Maliyet, üretim, satış, stok ve kârlılık verilerinizi uçtan uca izlenebilir hale getirin.
.png)
Toptan ve Perakende
Ürün, müşteri, mağaza ve kanal performansı; satış ve marj etkisiyle birlikte yönetin.
.png)
Lojistik ve Depo
Sipariş, sevkiyat, stok, teslimat ve operasyon performansını güncel verilerle izleyin.
.png)
E-Ticaret ve Kanallar
Pazaryeri, web sitesi, ürün, sipariş, iade ve stok verilerini tek merkezden görün.
.png)
Holding ve Şirketler
Şirket, şube ve iş birimi bazında finansal sonuçları karşılaştırın; yönetim raporlamasını standartlaştırın.
.png)
Hizmet ve Projeler
Gelir, gider, proje, müşteri ve ekip performansı daha ölçülebilir ve yönetilebilir hale getirin.
.png)
Reporting and Operations Support Request
Let's work together to evaluate the right support structure for your financial reporting, operations tracking, data analysis, and dashboard processes.